
By Erik Norland | –
Saudi Arabia, the top exporter among oil producers grouped under the Organization of Petroleum Exporting Countries (OPEC), and Russia announced on May 15 that they favoured extending production cuts for an additional nine months into 2018, rallying oil prices. The celebrations, however, might be short-lived. As we have pointed out on several occasions, fracking technology has made the United States a major swing producer in energy markets, diminishing the influence of Saudi Arabia and other OPEC members. OPEC members will meet on May 25 in Vienna to decide on renewing production cuts.
From just the end of October 2016, U.S. producers have added nearly 900,000 barrels per day (bpd) to their production, largely offsetting OPEC’s current production cuts. The rise in U.S. production has contributed to an extraordinarily flat futures curve for West Texas Intermediate crude oil, hugging $50 per barrel far into the landscape (Figure 1). And, the ability of U.S. producers to offset changes in production from OPEC countries may be contributing to a decline in both realized and implied volatility in crude oil (Figure 2).
The main questions for the markets are: 1) how much longer can U.S. production levels rise. 2) by how much are production levels likely to increase? The answers could have profound consequences for both oil prices and implied volatility.
Forecasting changes in U.S. production comes down to one key variable: the number of operating oil rigs. Energy services company Baker Hughes produces a weekly time series of the number of operating oil rigs that appear to precede U.S. production by about 15-20 weeks, on average (Figure 3). That is to say, if the rig count increases from this week to the next, the most likely outcome would be for U.S production levels to rise in about 15-20 weeks, or roughly 4-5 months.

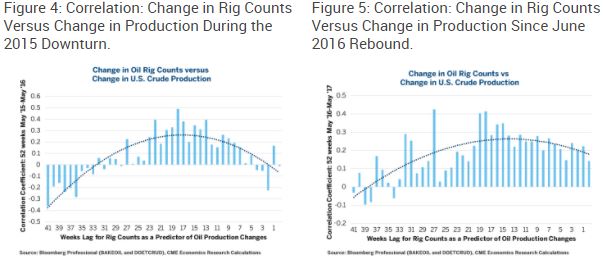
We tested the strength of this correlation between week-to-week changes in Baker Hughes’ rig counts and the week-to-week changes in total U.S. oil production using variable lags over two 52 week periods:
- The period of declining rig counts from early 2015 through May 2016.
- The subsequent period of rising rig counts from May 2016 onwards.
Both the declining and rising phases show that the strongest correlation between week-to-week changes in rig counts and week-to-week changes in U.S. oil production comes between 15 to 20 weeks (Figures 4 and 5).

This estimate corresponds closely to the actual behaviour of U.S. production during the past year. Rig counts hit bottom in late May 2016 and oil production began a sustained raise in late October, just over four months or 17 weeks later. If anything, the actual correlation between rig counts and production is probably far higher than the above data suggests: there is a great deal of ‘noise’ in both week-to-week changes in rig counts and week-to-week changes in total U.S. crude oil production. It’s surprising that the statistical relationship is even as strong as it is.
Most importantly for oil prices, the increase in rig counts has accelerated over the past several months. This implies that even if the oil rig count was to stop increasing immediately, we would likely see some continued increase in oil production.
Over the four months (17 weeks) ending May 5, the number of rigs rose from 529 to 703, an increase of 174. How much oil should one expect from each rig? Since the rig count began rising in May, the addition of one new rig has added a bit over 5,000 barrels per day to U.S. output, on average, about four months (17 weeks) later. If this ratio holds, the 174 rigs added over the past four months could be expected to add 870,000 barrels per day to U.S. production (in addition to a similar sized increase that has already taken place). This would bring total U.S. production to 10 million barrels per day, about 500,000 barrels per day above the previous peak. This would be terrible news for OPEC as the increase would more than offset the group’s entire production cut by 300,000 barrels per day.
However, the idea that U.S. production could increase 800,000-900,000 barrels per day over the next four months is probably not realistic. For starters, it would be a mistake to think that every rig is equally productive. When oil prices initially rebounded from $26 per barrel to around $52 between February and May 2016, U.S. producers began cautiously redeploying drilling equipment. Presumably, they tended to redeploy their most productive equipment in the most promising areas first. As the number of operating rigs continues to soar, one might expect the marginal productivity of each additional rig to drop over time.
Even so, the evidence to date suggests that the fall-off in productivity is not as great as one might have imagined. At the beginning of the rebound in rig counts last May, each new rig added about 5,500 barrels of oil per day 17 weeks later. Each rig added in December appeared to increase marginal production by about 4,500 barrels of oil per day (Figure 6). If this number continues to fall through the spring and winter of 2017 to, say, 3,500 barrels of marginal increase for each new operating rig, then one might still expect that by the end of Q3 U.S. production could have risen by an additional 600,000 barrels of oil per day. When added to the 880,000 additional barrels that the U.S. has been producing since the end of October, this will still be enough to both push the U.S. through its production peak and offset the totality of OPEC and Russia’s production output cut. Moreover, if the U.S. rig count continues to increase, one might expect further increases to crude oil production even beyond the additional 600,000 barrels per day that might be coming down the U.S. pipeline.

Those who have access to highly detailed information about each oil field will surely have an informational advantage over those who rely on publicly available data regarding future changes in U.S. production. That said, examining the relationship between changes in the Baker Hughes rig count and subsequent changes in the U.S. production levels gives those of us without access to such information a framework for forecasting changes in U.S. output.
Bottom line:
- OPEC and Russia proposed extending their production cuts but the resulting rally in oil prices might not last long.
- Since the end of October, U.S. producers have increased production by over 800,000 barrels per day.
- Rig counts precede oil production by about 15-20 weeks or by four months (17 weeks), on average.
- Over the past four months, U.S. producers have added an additional 174 rigs.
- 174 additional rigs could easily add 600,000 barrels of oil per day to total U.S. output by the end of Q3
Erik Norland is Executive Director and Senior Economist of CME Group. He is responsible for generating economic analysis on global financial markets by identifying emerging trends, evaluating economic factors and forecasting their impact on CME Group and the company’s business strategy, and upon those who trade in its various markets.